Pre-Built Widgets
LogZilla documentation for Pre-Built Widgets
LogZilla comes packaged with 14 pre-built widgets organized into categories: Generic widgets (7) including EventRate, LastN, Notifications, Tasks, and TopN widgets; System widgets (5) for monitoring CPU Load, Disk IOPS, Memory Usage, Network Utilization, and Storage; and Cisco IOS widgets (2) for service impacting events. Each widget type can be customized and configured for specific monitoring needs.
Event Rate Widgets
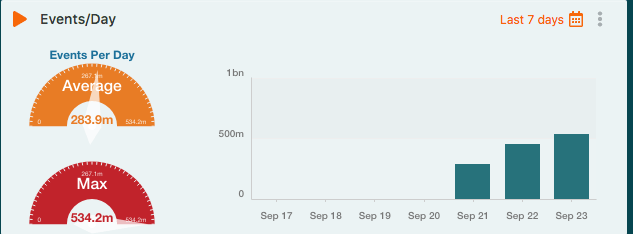
These widgets give users a quick view of current and long-term event rates. Large changes in these can indicate changes in traffic, configuration problems, or security events, among other things. Spikes in these graphs should be investigated as part of routine maintenance.
LastN Widgets
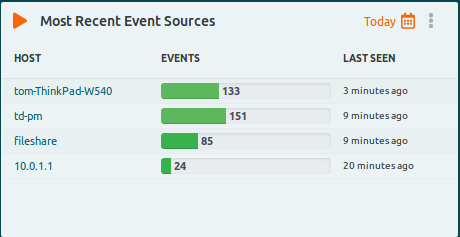
The sample widget in this section shows the Most Recent Event Sources. By changing the title and parameters, it can display Mnemonics, Hosts, or other data.
Messaging
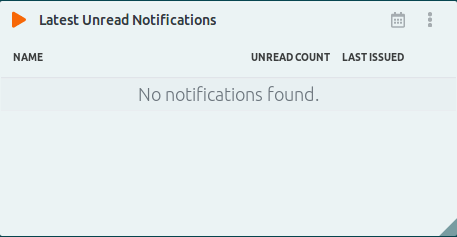
This widget displays the Latest Unread Notifications. Notifications are generated by triggers that users create. See the Alerts Overview documentation for more information.
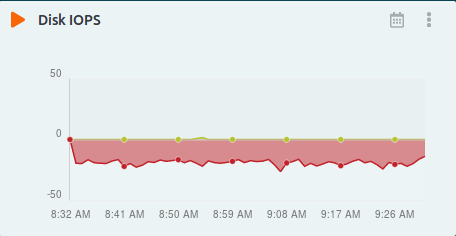
System Widgets
These widgets allow monitoring of the LogZilla server status. Options include CPU Load, Memory Usage, Network Utilization, Storage, and Disk IOPS. For high traffic servers that require 100% uptime, these widgets can help indicate issues before they become downtime.
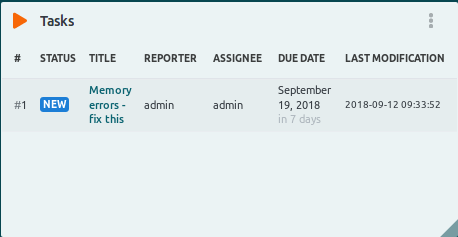
Tasks Widget
This widget displays any tasks created by, or assigned to the user. Tasks can be created on the Tasks page.
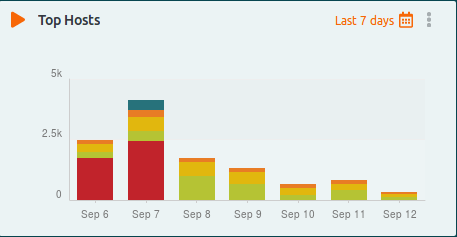
TopN Widgets
These widgets include Top Hosts and Top Programs. These can also be customized in many ways, and will be covered below in further detail.