Dashboard Overview
LogZilla documentation for Dashboard Overview
LogZilla Dashboards
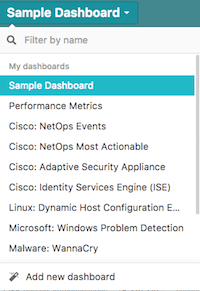
Dashboard Selector
The first drop-down on the left allows selection from existing dashboards or creation of a new one.
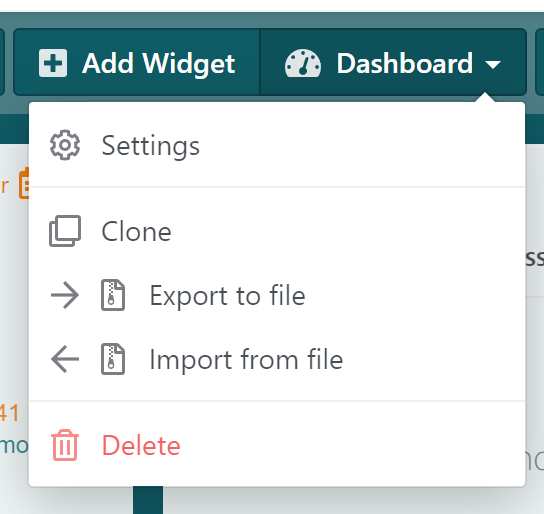
Dashboard Options
The dashboard drop-down on the right side of the UI shows available options for
Settings, Clone, Export to file, Import from file, and Delete of
dashboards.
Exporting
Dashboards may be exported to JSON format for modification, sharing, and other purposes.
Adding Widgets
Widget types are listed in the "Add Widget" menu option which allow customization of widget filters once that type is added.
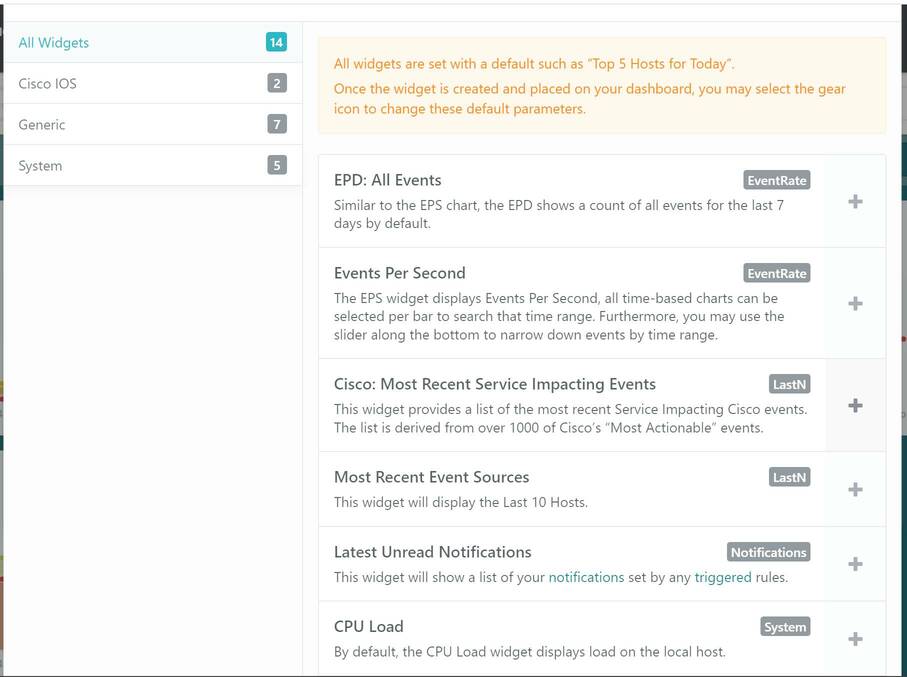
For more information on tailoring widgets to specific needs, see the section "Creating your own widgets".
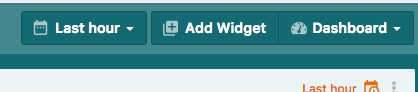
Time Range Selector
There are two options for specifying the time ranges that will be displayed in widgets. Each widget may be customized on an individual basis for its own time range, or set to use the dashboard's time range selection.
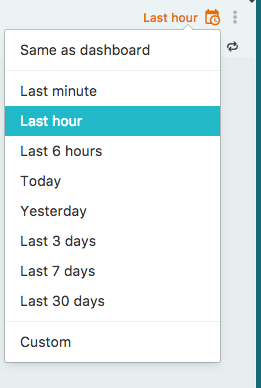
Setting a widget to "Same as dashboard" tells that widget to use the time range set in the dashboard itself.
Dashboard Time Range Selector
Widget Time Range Selector
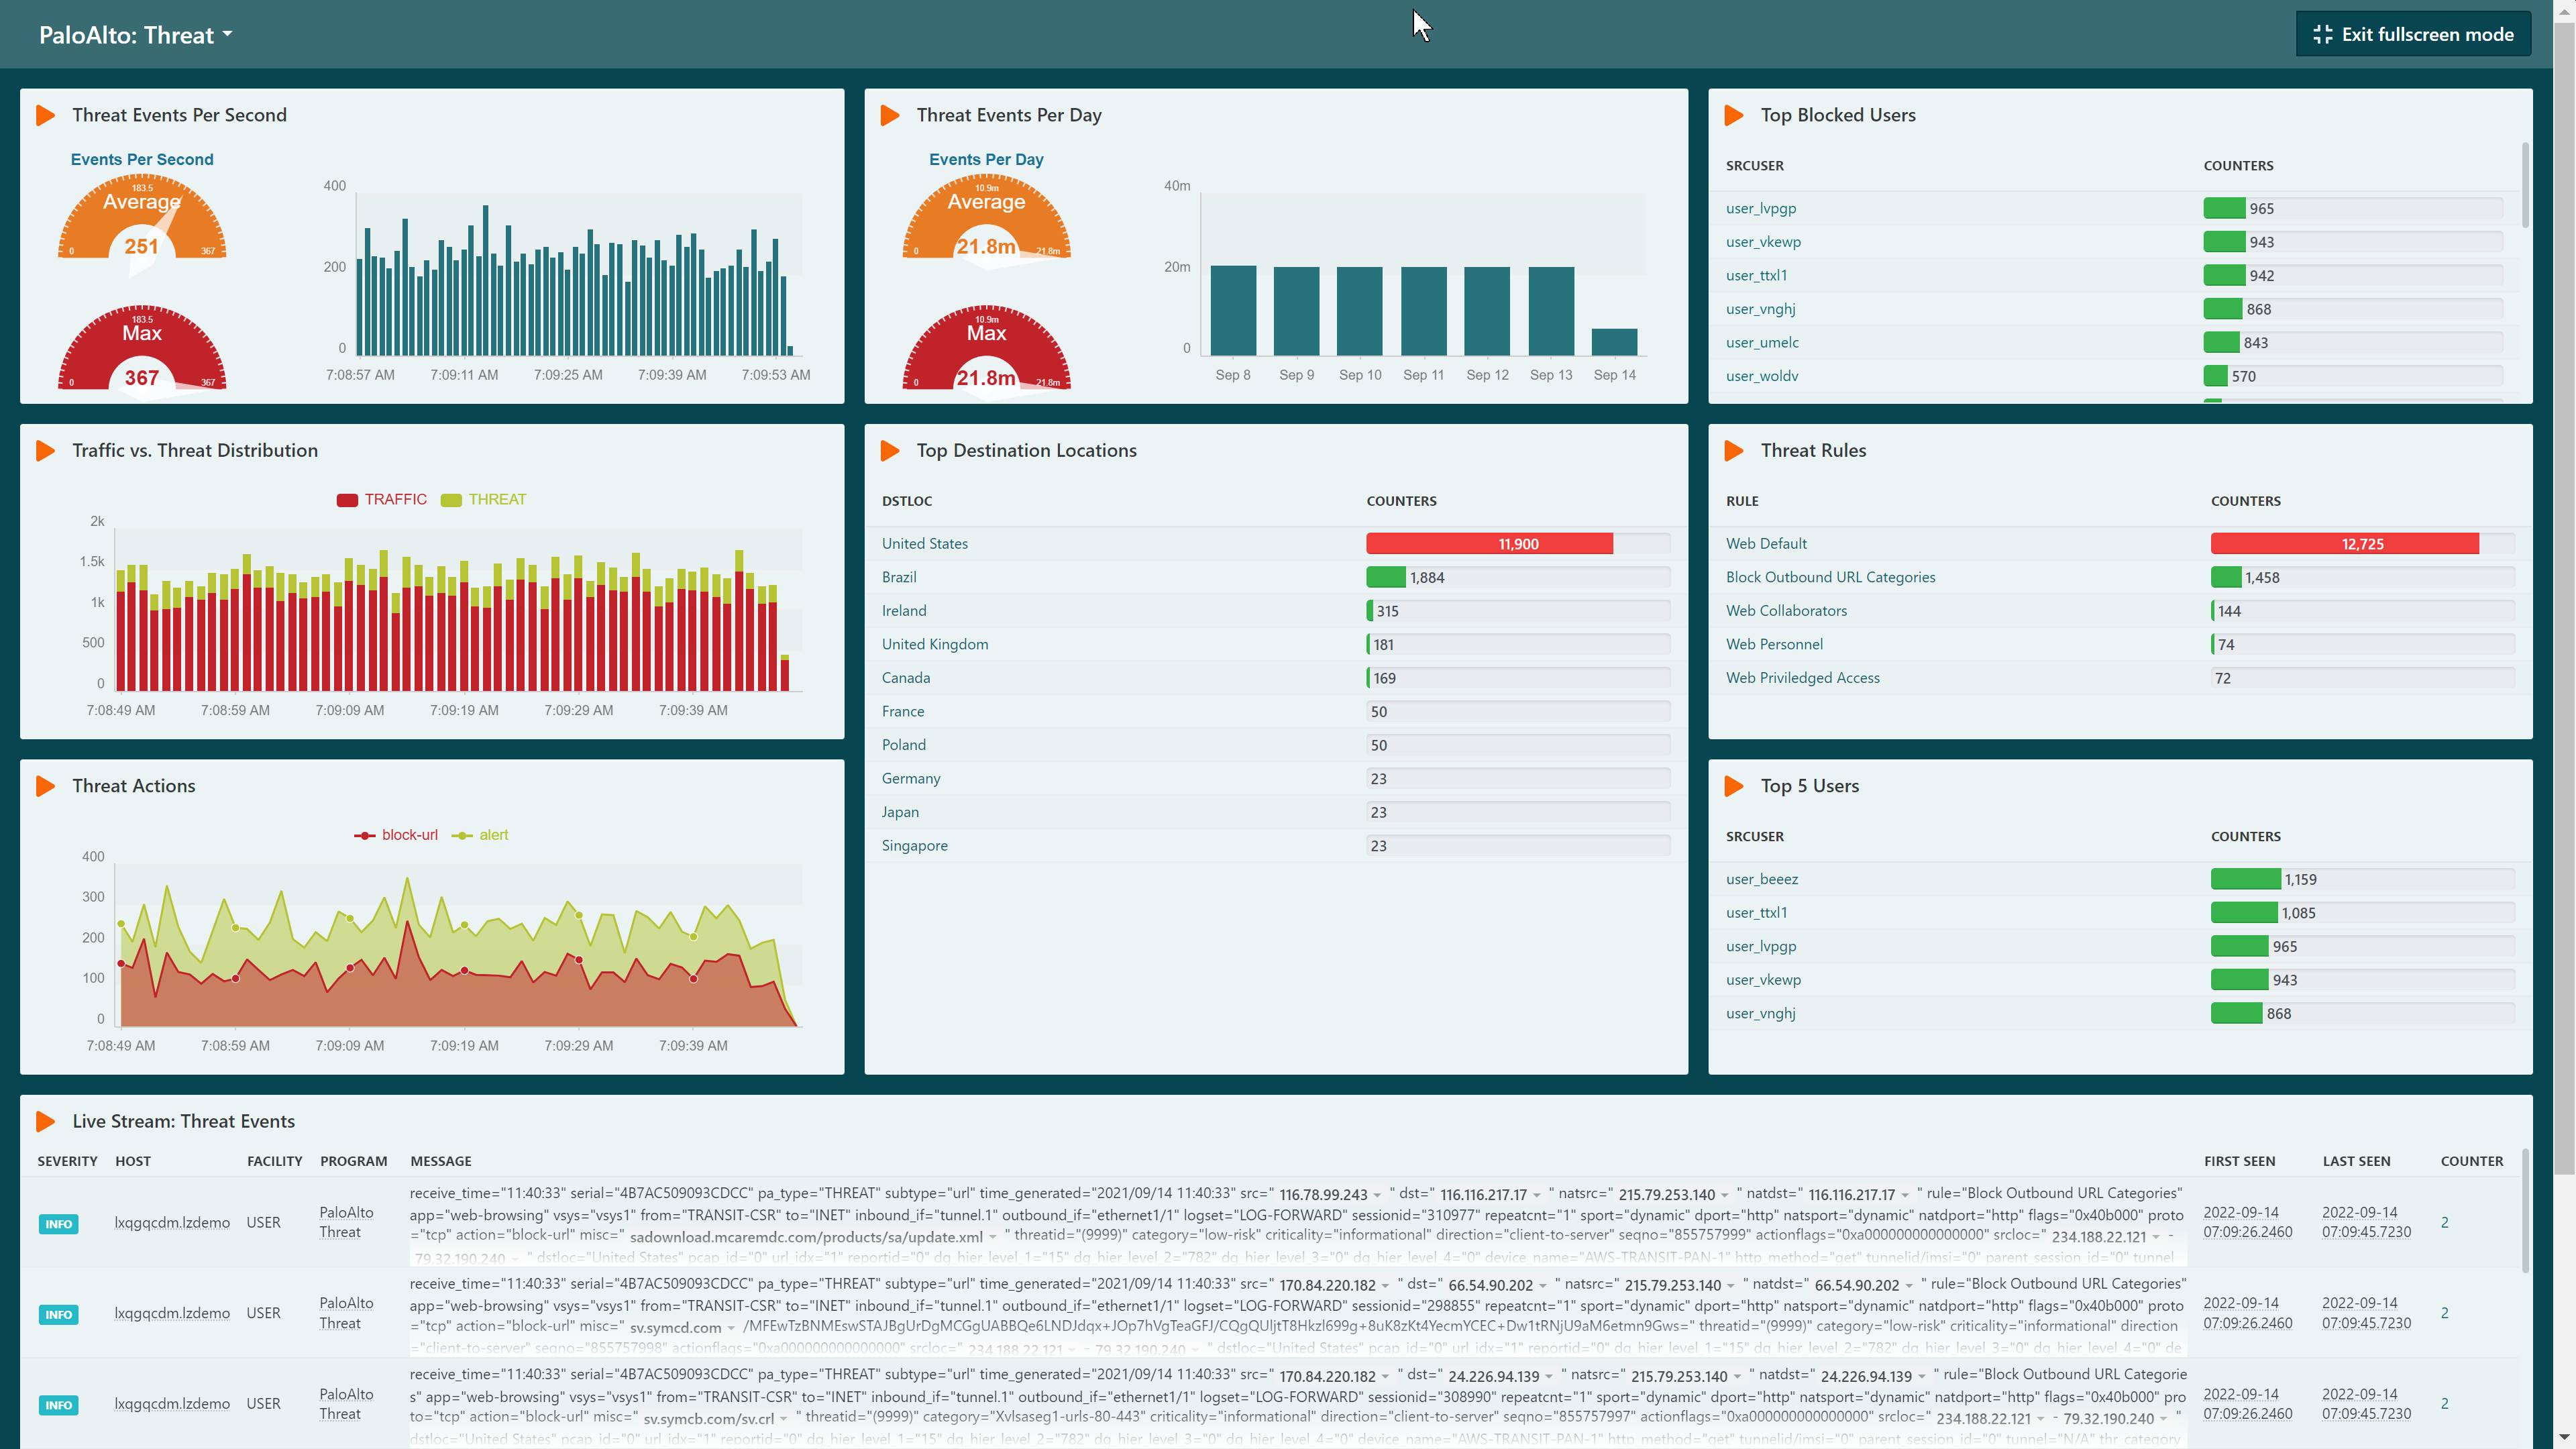
TV Mode
TV Mode may be used to maximize the LogZilla dashboard as a full-screen view. In TV Mode, all navigation, search, and other interface elements are removed from view so that only the dashboard widgets are displayed. This is particularly useful in large-screen Network Operations Centers.